Sequence Risk and Asset Allocation
Feet in the oven, head in the freezer. What's my average, Joe?
“What happens when you are wrong is everything in investing. You must construct a portfolio to survive those times” - Seth Klarman
Foreword
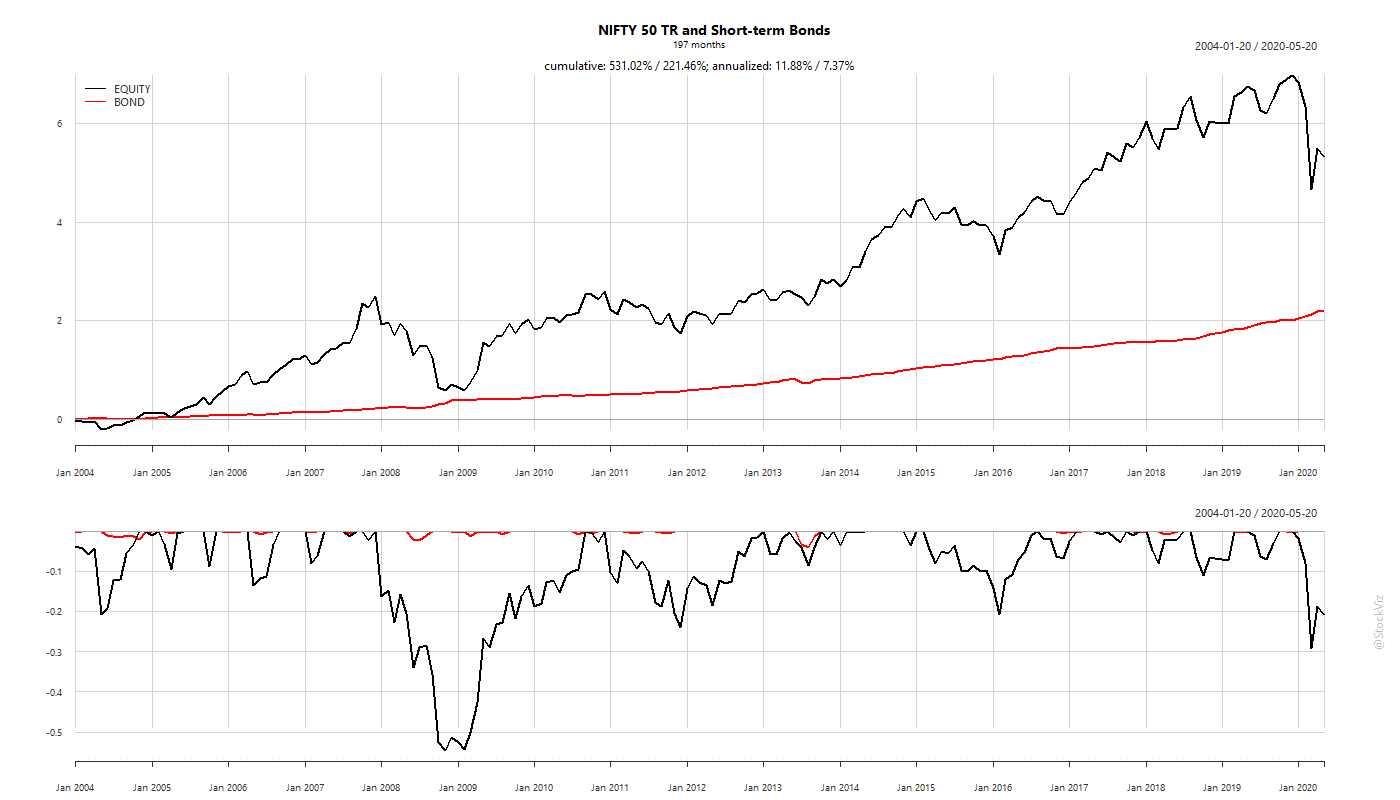
Being an investor requires a strong stomach to absorb volatility and losses. As the chart below illustrates, quite often the market experiences sell-offs that are greater than 25% and in 2008, the market corrected by more than 60%.

While the market has eventually recovered from these sharp sell-offs, there is no guarantee that the present correction or a future one will be a quick recovery to new highs. The Japanese frontline index, the Nikkei 225 has still not reached its peak that it touched in 1991.
This has real consequences to our lives. If your retirement is imminent or looking to send your kid to study aboard next year and were looking to your investment portfolio to to fund them, those goals are now in jeopardy.
When you step back and ask yourself: Why am I investing? You’ll realize that beating a benchmark or outperforming your friends is pretty far down the list. Money, at the end of the day, is a means to an end. It gives you the ability to fulfill your life’s ambitions, achieve financial independence and live your life the way you want.
So how do we get there?
An average investor rarely sees average returns
“5 out of 6 customers say they are extremely satisfied with our Russian Roulette.” - Ole Peters
Investor: On average, over the last 20 years, the NIFTY has given a CAGR of 10%. So, if I invest Rs 1 lakh for 5 years, I should get at least Rs 1.61 lakhs, no?
Me: No. Consider yourself lucky if you don’t lose money.
Investor: But it has given negative returns only 4 years out of 10. I can survive 2 years of negative returns.
Me: Let me tell you something about sequence risk. Sequence risk means that it is possible that you could have all of those negative 4 years during the 5 year period that you have invested.

What most investors don’t realize is that while averages maybe true in the aggregate, they may not survive long enough in the market for their personal experience to match up with the statistics.
One way to visualize this problem is to simulate parallel paths that an investment could have taken, keeping its statistical properties the same, for your investment horizon.
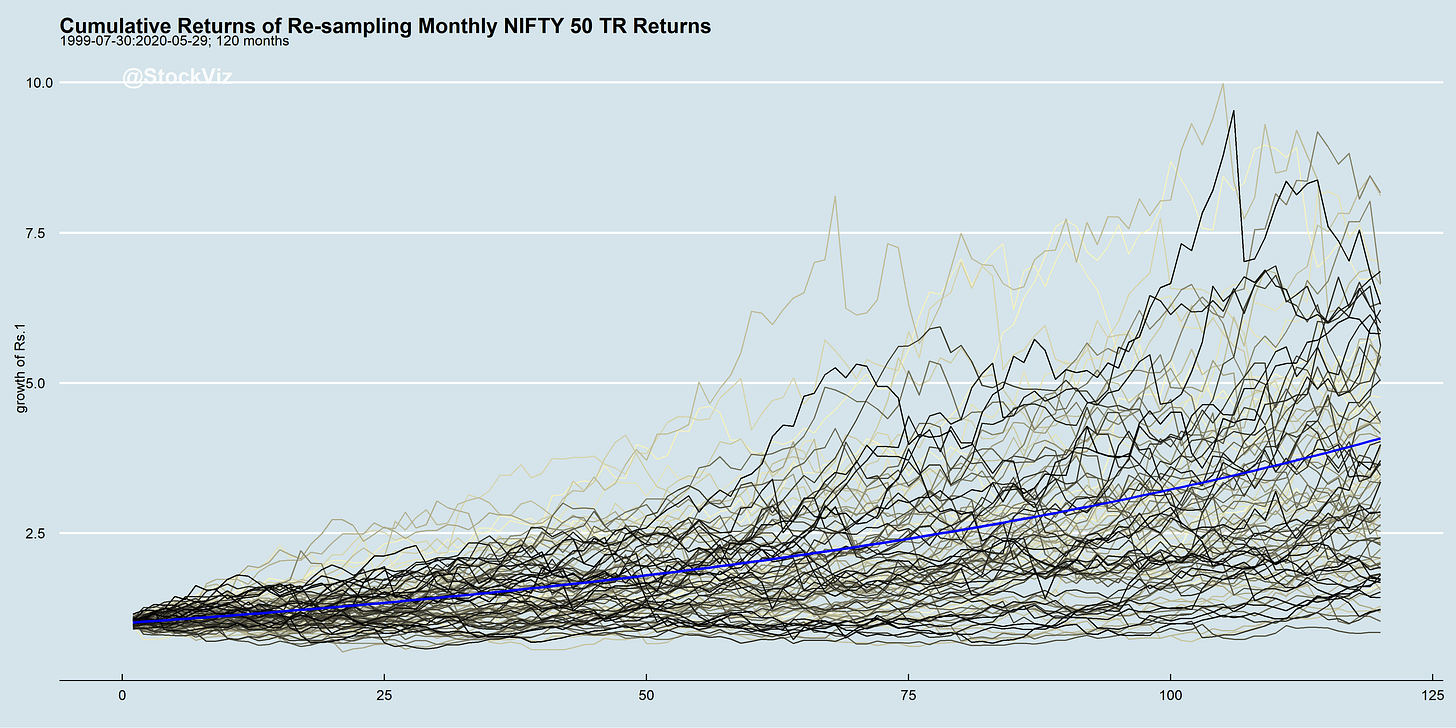
Say, your investment horizon is 10 years. You can simulate 100 different ways your investment might have done during that period by simply re-sampling the returns over and over again:

The blue line is the average. The chart highlights that you could very well end up with negative returns in a given 10-year period even if NIFTY’s statistical properties did not change. This is sequence (also called sequence-of-return) risk.
To reduce this type of risk, there are two approaches that have known to work:
Diversification. Allocate to bunch of non-correlated assets.
Get Tactical. Markets are known to trend. Exit from assets who’s prices are trending down to avoid future losses.
We’ll discuss Tactical approaches in subsequent posts. This week, we’ll give you a simple way to think about allocating between stocks and bonds to get to an optimal risk/reward proposition that is right for you.
Diversification, Asset Allocation, Stocks & Bonds
Risk rises with the number of factors affecting the outcome.
For equities, that means future expectations of growth, economic backdrop, competition dynamics, capital efficiency, etc.
For sovereign bonds, there is only one factor: solvency of the country. As long as you hold the bond to maturity, the only factor that you should be worried about is whether the government will return the money at the end, or not.
While interest rates, inflation, capital flows, etc. affect the mark-to-market prices of bonds, most of it is irrelevant for an investor holding short-term bonds to maturity.
Sovereign bonds, because of their vastly lower risk compared to equities, fluctuate a lot less and, surely enough, give lower returns.

How much lower? Vastly lower: ~7% vs. equity’s ~12%
But! Given their lower volatility, if you combine bonds with equities, the overall portfolio will have considerably less volatility than equities alone. This lowers the sequence risk and pulls an average investor’s returns towards the average of the investment.
The story behind the rule of thumb
“I should have computed the historical co-variances of the asset classes and drawn an efficient frontier. Instead, I visualized my grief if the stock market went way up and I wasn’t in it–or if it went way down and I was completely in it. My intention was to minimize my future regret. So I split my contributions 50/50 between bonds and equities.” - Prof. Harry Markowitz, who shared the Nobel Prize in economics in 1990 for his pioneering work on the mathematical underpinnings of diversification.
The key thing to remember is that as a portfolio gets closer to the end of its investment horizon, lower the risk it should take. Here’s a simulation that highlights the risk/reward trade-off between different equity/bond portfolios:

While a 95/5 split between equities and bonds has a high average return, its returns under the worst case scenario is lower than the average for a 5/95 portfolio. You are not guaranteed higher returns just because you took more risk.
Fortunately, its possible to get reasonable returns even with a 55/45 split if you understand the trade-offs. It significantly reduces probability that an average investor ends up with negative returns while keeping returns close to the average as possible.

Conclusion
While equities give higher returns on average, investors face sequence risk when investing for horizons less than eternity. One way to reduce the probability of negative/low returns is by combining equities with a lower-risk investment. Namely, sovereign bonds.
The closer the investment gets to its exit point, the larger the proportion of low-risk investments it should hold.
A 50/50 split between equities and bonds is not a terrible choice if it helps get over the analysis-paralysis phase.

