

90 days of All Star Portfolio
90 days of All Star Portfolio
A performance update of our slow-moving, low-turnover momentum portfolio

We introduced the All Star Portfolio a couple of weeks ago. While the backtest looks attractive, the proof, after all, is in the pudding.
We had setup the automated system back in early May and forward-tested it for a couple of months before releasing it out in the wild. Recently, it completed 90 trading days. Here are some of the stats.
Cumulative Performance

The initial flat line that you see is because there were no stocks hitting all-time-highs (ATH) during that time. The portfolio was mostly in cash and escaped the first drawdown in the markets that came its way. This is one of the advantages of a portfolio that can wait in cash for the markets to stabilize.
Since then, the portfolio gradually filled all its 25 slots with stocks hitting their ATH.
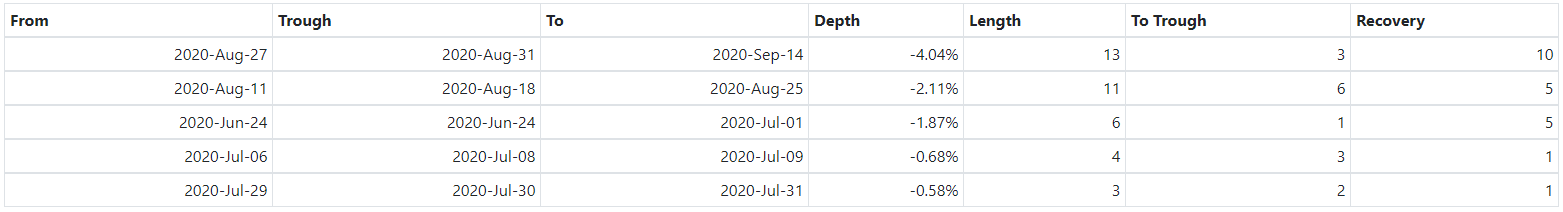
Drawdowns
Right now, the portfolio is not in a drawdown. But its still 90 days, so give it time… its a momentum strategy after all :)
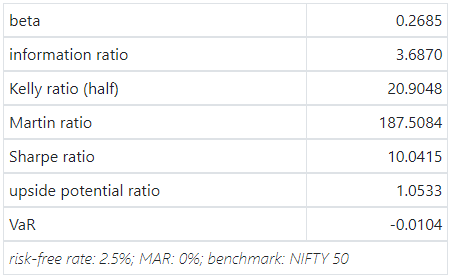
Metrics
Its too soon to generalize performance metrics at this point. The portfolio should age at least a year before these numbers start to reflect the underlying reality. Just leaving it out here as a snapshot for comparing at a later date.
Subscribe!
With a paid subscription to FreeFloat, you will be emailed changes to the All Start Portfolio as and when they occur.
A full year subscription will run you Rs. 5000/-. Please do an account transfer if the Substack payment gateway is not working for you.
Flameback Capital Private LimitedAccount ID : 004705011367IFSC Code: ICIC0000047Email: kishan@flamebackcapital.comPhone: 984502921Post transfer, send us the details and we’ll send you an invoice and add you on the subscribers list.